To begin with, Google Trends is a public web facility that helps to trace search-volumes in Google.
Just imagine that due to this service business analysts can assume the volume of stock transactions, and healthcare companies and pharmaceutical companies can monitor the incidence of the population. And all this works just because Google collects and processes data about each query.

It is a real treasure for the blogger, because everyday you can watch in real time what is interesting for the audience and plan "hot-topics" videos , make creative headings and descriptions to your videos.
So, print trends.google.com in the search bar, follow the link. On the main page you'll see top queries, top people and a query with the fastest growing dynamics. Changing the region you can find out what is interesting to the audience anywhere in the world and use this information for your next video.
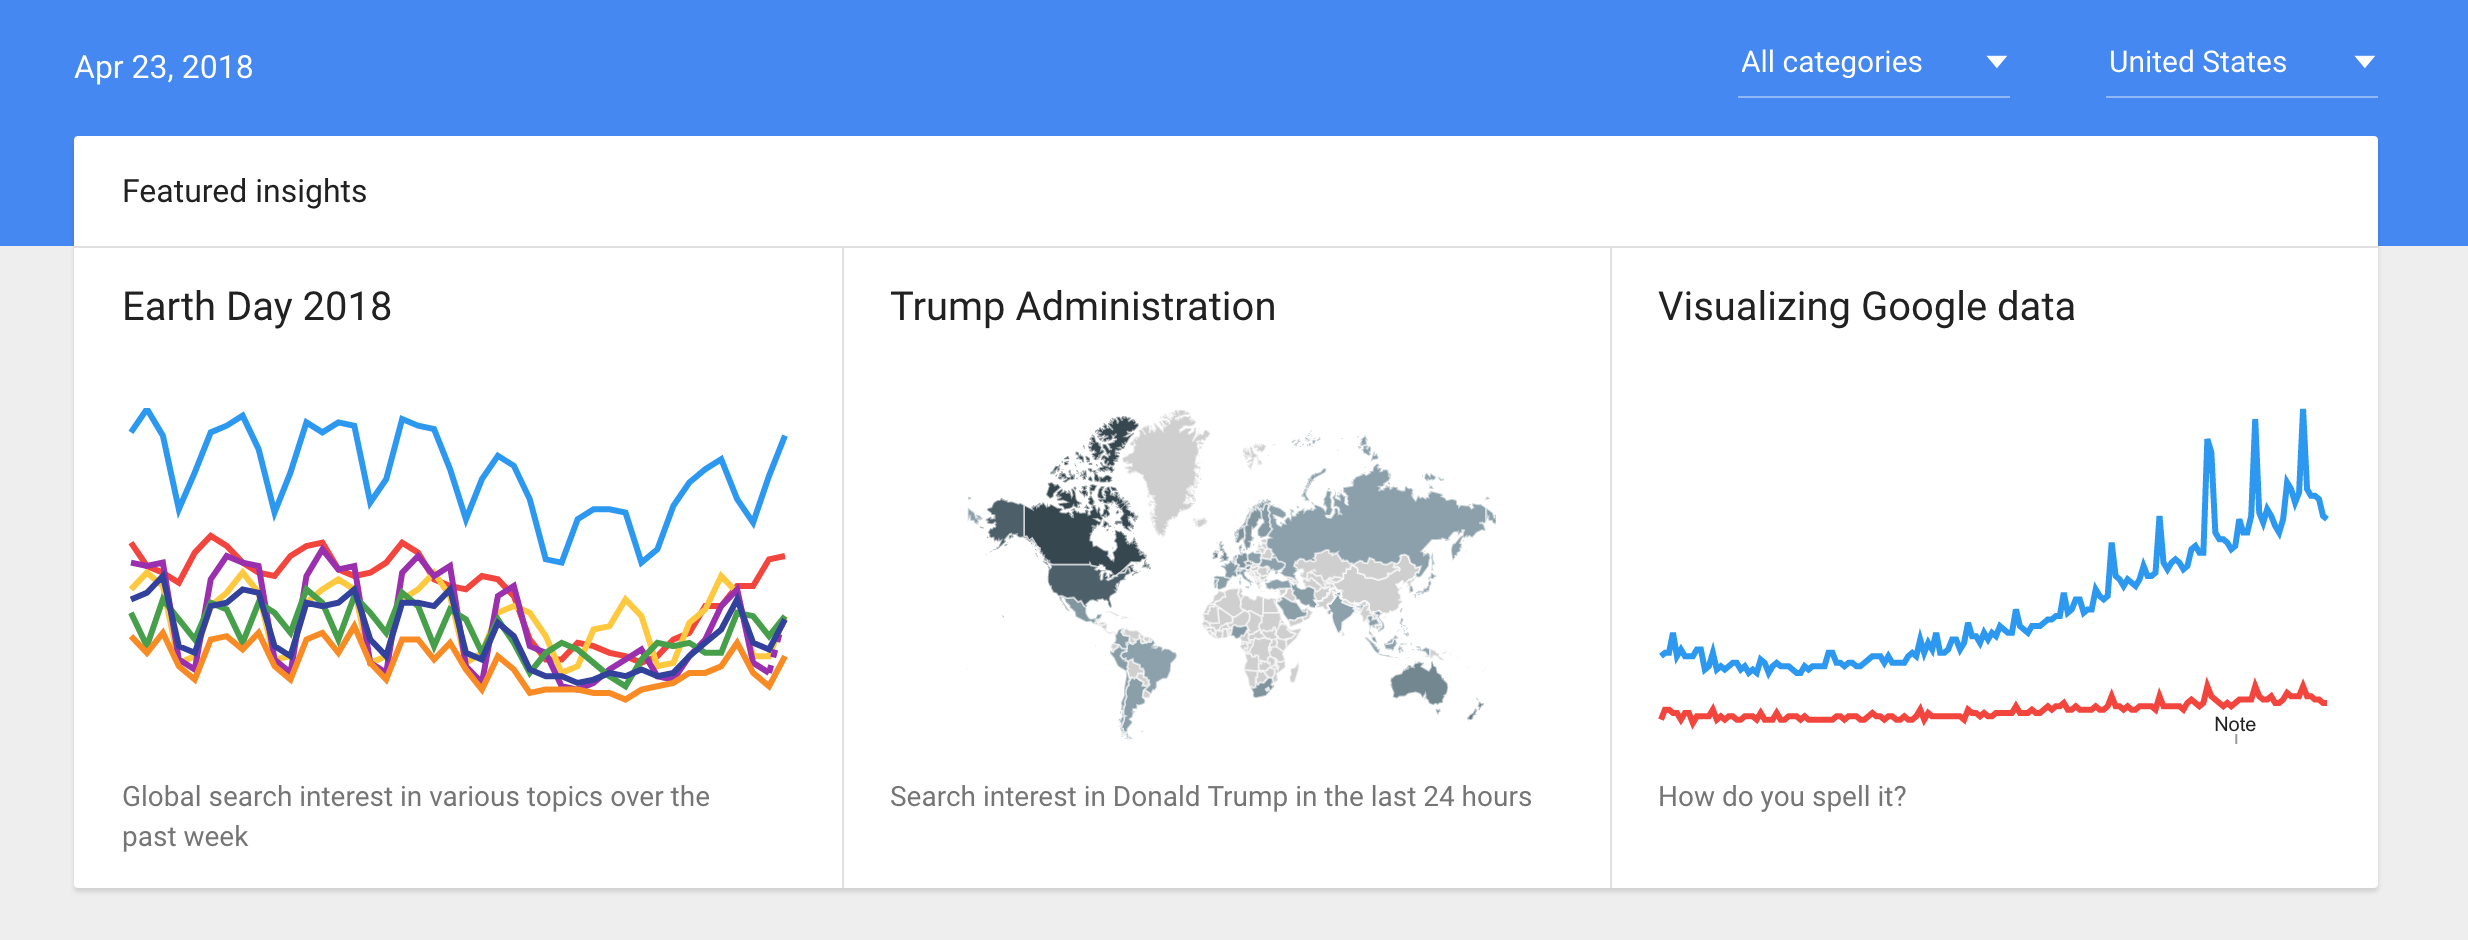
Take into account , that in the dynamics of popularity you can see the ratio of growth in interest to the topic to the number of news articles. This is important if you want to attract as much interest to your channel as possible, including from side of the media.
When your video is ready for publication, it's important to give it the right name because the viewers find the video due to its metadata - the heading, the description and the tags.
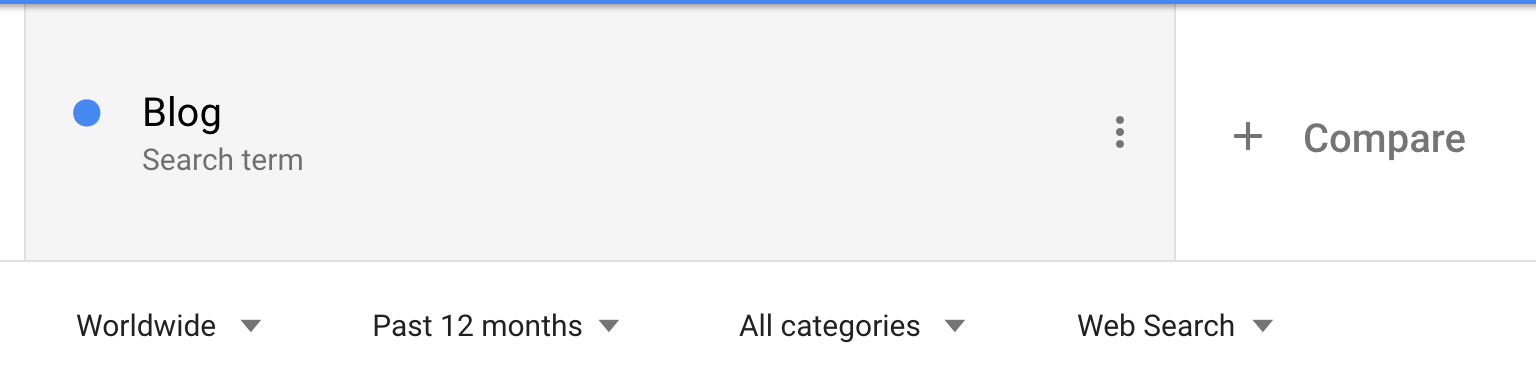
In the search bar on Google Trends site we type the word that you want to use in the heading. For example, "blog". Click "Search" and see the dynamics of the popularity of the word. It can be traced using 4 criteria: region, period, category and search site.
And the most important for us is YouTube search. For the name of your video choose the word with the highest growth. This will give your video extra chances to increase the views.
Another useful function is the ability to compare words and phrases. For example, if you don't know what name to choose, Google Trends will tell you which option is the most effective in terms of search.
Below the chart you'll even find the rating of popularity in subregions and cities, and also similar queries.
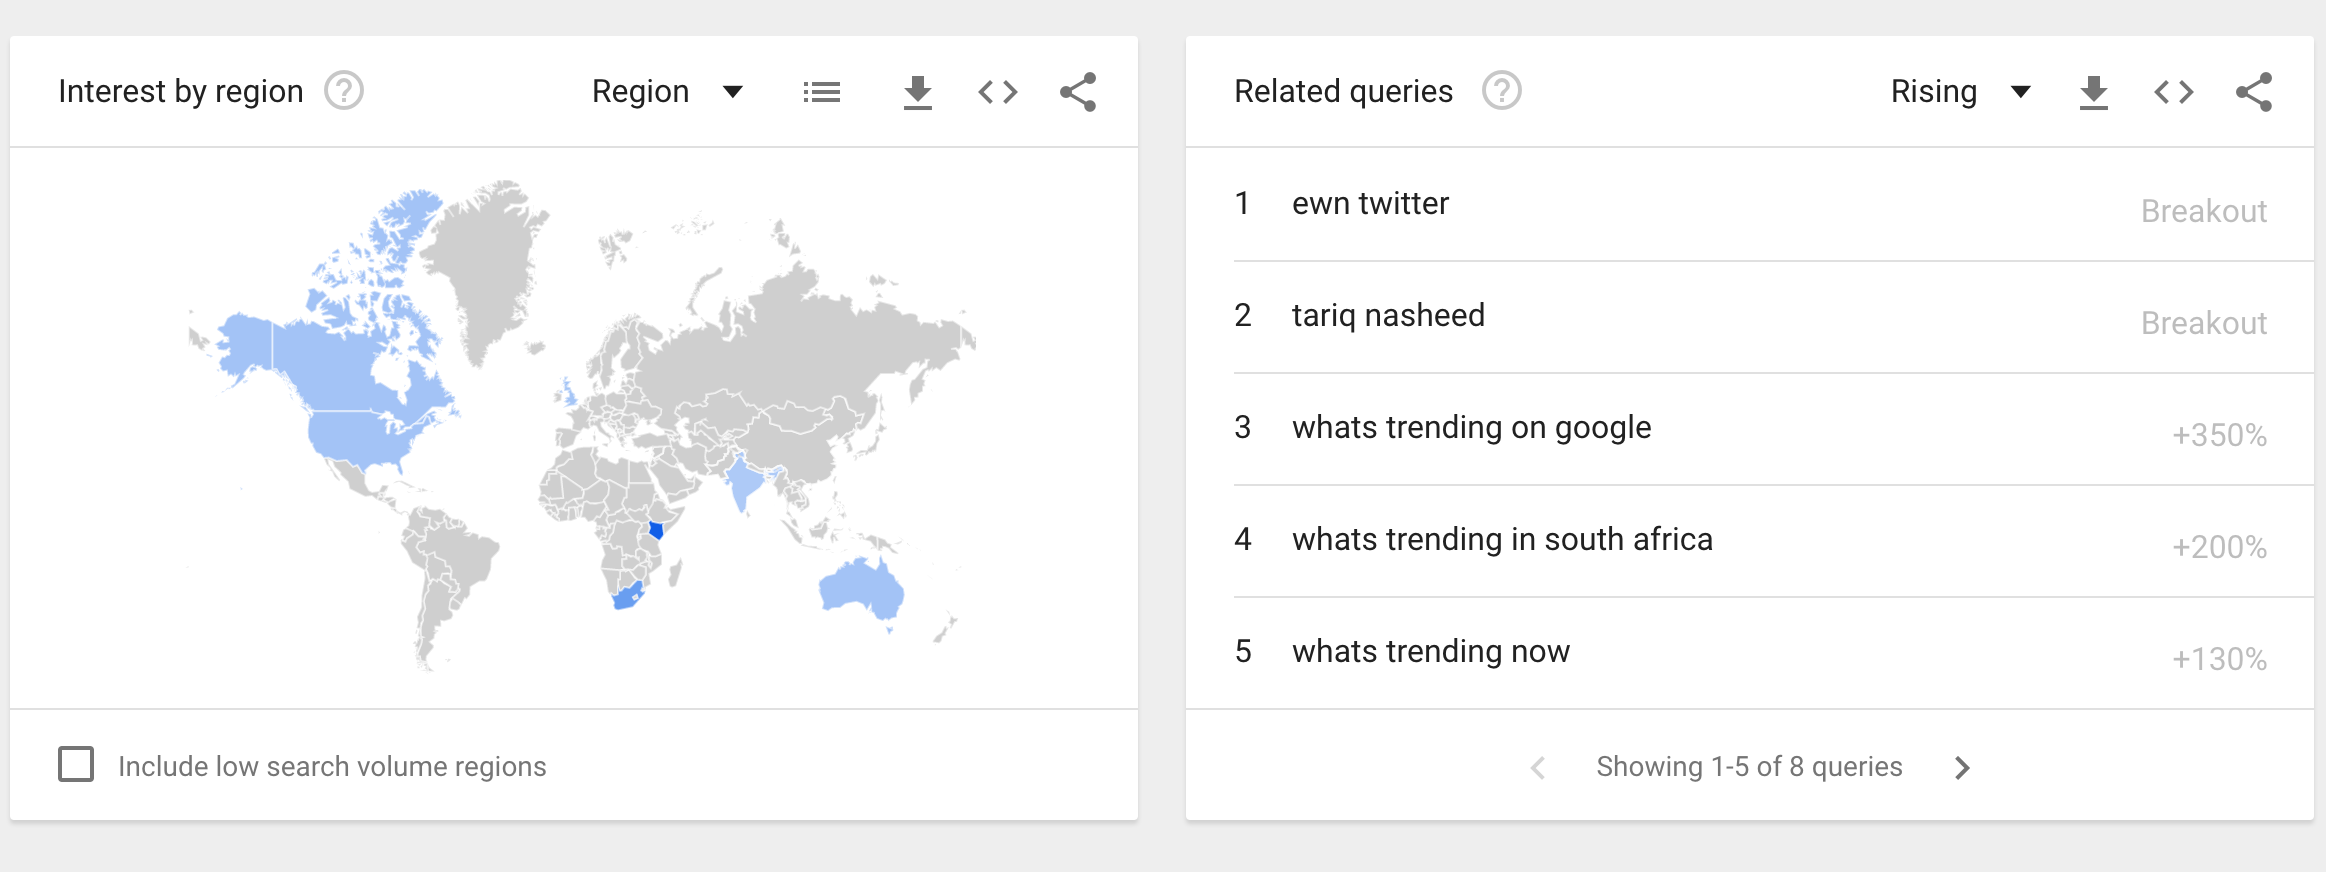
Pay attention that there are three important buttons in the right corner above the chart: down arrow lets you download the data in the form of an Excel table, brackets help you to embed the link to the site and such a sign helps you to share the information in Google+, Facebook, Twitter, Linkedln and Tumblr.